PCB Market Enters 2026 With Diverging Signals: Shipments Rise, Bookings Contract
The Global Electronics Association announced today the January 2026 findings from its North American Printed Circuit Board (PCB) Statistical Program.
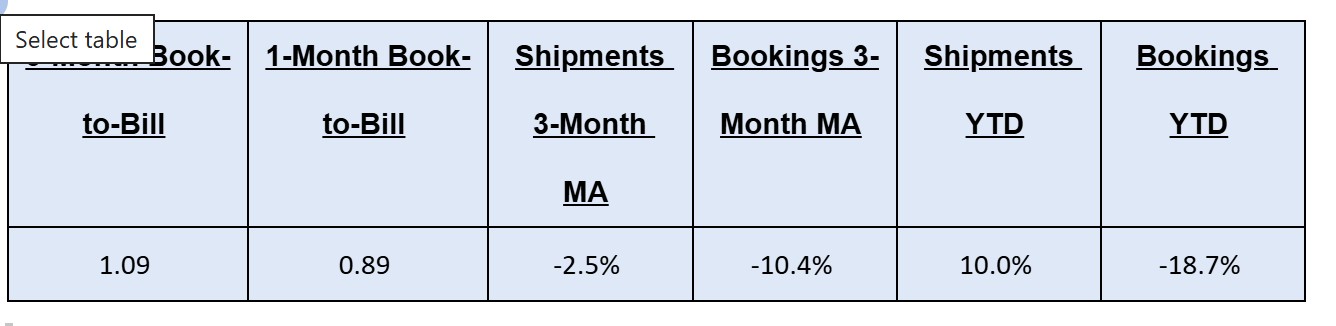
North American PCB results for January were mixed. Shipments rose 9.1% sequentially from December but started the year down on a year-over-year basis. Bookings were the softer story, falling 15% from December and dropping 16.5% year-over-year, a notable pullback after a stronger close to 2025.
The three-month book-to-bill held at 1.09, keeping the trend technically in expansion territory, though the divergence between the monthly and three-month reads is worth watching. The three-month moving averages remain positive on both shipments and bookings, suggesting momentum remains positive and the broader trend has not reversed, but January's demand signal is a cautionary note heading into the quarter.
"January's PCB results reflect a market where shipments are holding up, but the demand signal is flashing caution,” said Dr. Shawn DuBravac, Global Electronics Association’s chief economist. “With bookings dropping sharply from December and the one-month ratio below parity, the next few months will tell us whether this is a pause or the start of a softer trend.”
Detailed Data Available
Companies that participate in the Global Electronics Association’s North American PCB Statistical Program have access to detailed findings on rigid PCB and flexible circuit sales and orders, including separate rigid and flex book-to-bill ratios, growth trends by product types and company size tiers, demand for prototypes, sales growth to military and medical markets, and other timely data.
Interpreting the Data
The book-to-bill ratios are calculated by dividing the value of orders booked over the past three months by the value of sales billed during the same period from companies in the Global Electronics Association’s survey sample. A ratio of more than 1.00 suggests that current demand is ahead of supply, which is a positive indicator for sales growth over the next three to 12 months. A ratio of less than 1.00 indicates the reverse.
Year-on-year and year-to-date growth rates provide the most meaningful view of industry growth. Month-to-month comparisons should be made with caution as they reflect seasonal effects and short-term volatility. Because bookings tend to be more volatile than shipments, changes in the book-to-bill ratios from month to month might not be significant unless a trend of more than three consecutive months is apparent. It is also important to consider changes in both bookings and shipments to understand what is driving changes in the book-to-bill ratio.
The Global Electronics Association’s monthly PCB industry statistics are based on data provided by a representative sample of both rigid PCB and flexible circuit manufacturers selling in the USA and Canada. The Association publishes the PCB book-to-bill ratio by the end of each month.